

[Originally Posted 27 April 2020 here.]
Just a quick “Learn from my Mistakes” post here.
Let me first say that the Task Sequence Debugger is an excellent tool and can and will make troubleshooting task sequences so much easier. BUT, there is a catch….
I have taken the opportunity during the COVID-19 lockdown to rebuild my lab from the ground up. While troubleshooting an OSD task sequence I thought I would give the Task Sequence Debugger a try. Using the Microsoft docs as a guide I created a collection and set a collection variable “TSDebugMode” set to True. I then dropped my test machine into that collection, PXE booted and and kicked off my OSD sequence.
During the WinPE phase the debugger worked wonderfully. I was able to step through my simple sequence with ease. The image applied, drivers were injected, the ConfigMgr client was installed and the system rebooted into OOBE. Here things became, how shall we say, less happy.
I noticed the OOBE seemed to run on forever and never hitch itself back up to the task sequence. If I were to Alt-Tab, I found that the debugger was running, but I could not switch over to it.
Well now that’s a bummer!
Back to the documentation. I probably should have read it completely before starting, but who does that? Well, I found this little note toward the end:
The task sequence debugger continues to run after a Restart Computer step, but you need to recreate any break points. Even though the task sequence may not require it, since the debugger requires user interaction, you need to sign into Windows to continue. If you don’t sign in after one hour to continue debugging, the task sequence fails.
During OOBE no user is logged in, so the debugger sits in the background (unreachable) waiting for input that never happens.
So, how can we use the debugger during an OSD sequence?
The short answer is that you simply turn the debugger off prior to OOBE and then turn it back on afterwards.
Okay, then how do you turn the debugger on and off?
You set the TSDebugMode variable to True to turn it on, and False to turn it off. Put these as actions in your task sequence and you are all set, with another catch. You need a reboot after the “Setup Windows and Configuration Manager” action. Why is that? If you do not put a reboot in at that spot (or at least prior to turning the debugger back on), the system slides back into the task sequence while still in the OOBE “lockdown” and you’re right back where you started with the debugger running but unreachable and hanging the entire process.
Here is my basic sequence:
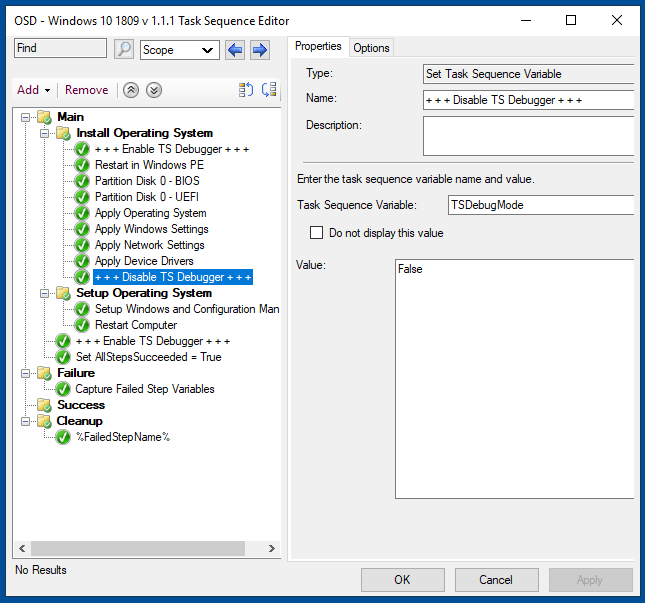
If you think it looks familiar, it should. Kudos to Adam Gross and his Building a Better Task Sequence. His work is the foundation on what this task sequence will be built upon.
Anyway, I turn on the debugger at the start of the sequence, turn it off immediately prior to the “Setup Windows and Configuration Manager” action, then immediately after I added a reboot (to get out from the OOBE lockdown) and turn the debugger back on. This allows me to leverage the debugger throughout the entire task sequence with the exception being that window during OOBE.
Okay, now that I have that sorted out I can get back to adding web services, front ends, applications, logging, etc.
References:
https://docs.microsoft.com/en-us/mem/configmgr/osd/deploy-use/debug-task-sequence